
Dynamic Graph is a 24Flow component that you can drag-and-drop on the Team Cockpit page layout. It is a generic component that can be used for visualizing various types of metrics via a custom controller.
In this section, we will describe how to use the Dynamic Graph component for team workload visualization. This workload graph can be integrated in a Team Cockpit or on a (management) overview page with a workload overview of all teams.
24Flow also provides a controller for this use case. If you would like to reuse the component for other use cases, please contact the 24Flow support team.
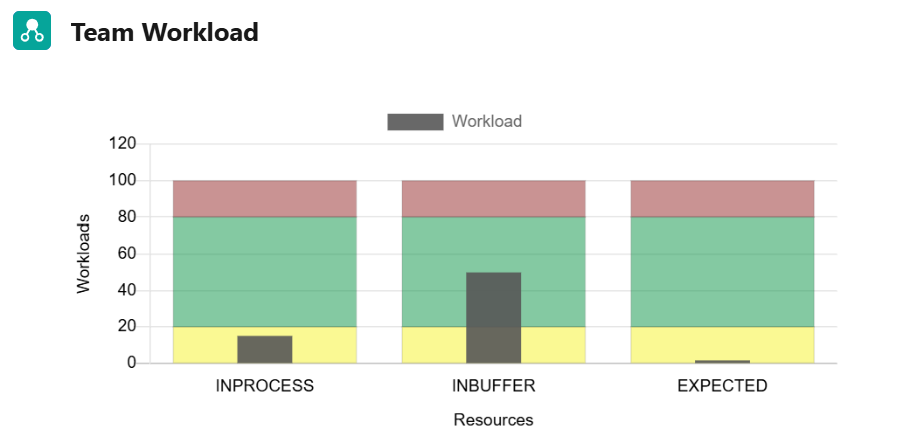
Before we go through the detailed settings, here is an example of the team workload visualization via Dynamic Graph:
The settings of the Dynamic Graph component are configured in Custom Metadata Types in Setup.
The following parameters can be configured:
Component Configuration
-
Controller Override: Dynamic controller used to retrieve the data for this graph.
-
Platform Event: API name of the Platform Event that will trigger a reload of the graph.
-
Resource External Id: In the case of workload visualization, this will be the external Id of the team. This implies that you will need a separate Dynamic Graph Custom Metadata Settings for each team for which you want to visualize the workload.
-
Icon Name:
Chart Configuration
-
Graph Title: Title shown at the top of the graph, in the example above ‘Team Workload’.
-
Data Background Color: This is the color of the gray bars in the example above. In this example we applied the setting ‘rgba(88, 88, 88, 0.90)’ representing a color with an opacity of 90%, where the RGB components are R: 88, G: 88, B: 88, which is a dark gray color.
-
Data Label: Label for the resources shown in the graph, in the example above ‘Workload’.
-
Display Legend: Show/hide the legend in the dynamic graph.
-
Offset Start: Used to define the offset on the X-axis, in the example above 0.1.
-
Offset End: Used to define the offset on the X-axis, in the example above 0.9.
-
X Gridlines/ Y Gridlines: Show/Hide horizontal/vertical gridlines.
-
X Label/ Ylabel: Label for the X-axis / Label for the Y-axis. In the example above respective ‘Resources’/'Workloads'.
-
Y Min / Y Max: Minimum/Maximum value shown on the Y-axis. In the example above respectively 0/120.